GELU
研究者表明,收到dropout、ReLU等机制的影响,它们都希望将不重要的激活信息规整为0,我们可以理解为,对于输入的值,我们根据它的情况乘上1或者0,更数学一点的描述是,对于每一个输入x,其服从标准的正太分布 N(0,1) ,它会乘上一个伯努利分布 $Bernoulli(\phi(x))$ 其中,$\phi(x)=P(X<x)$ 。
随着x的降低,它被归零的概率会升高,对于ReLU来说,这个界限就是0,输入少于零就会被归为0,这一类激活函数,不仅保留了概率性,同时也保留了对输入的依赖性。
GELU :高斯误差线性单元激活函数,在最近的Transformer模型(谷歌的BERT和OpenAI的GPT-2)中得到了应用,GELU的论文来自2016年,但是最近才引起关注,这种激活函数的形式为:
$$
xP(X<x)=x\phi(x)
$$
其中$\phi(x)$ 是高斯正态分布的累积分布:
$$
xP(X<x) = x \int^x_{-\infty}\frac{e^{-\frac{(x-\mu)^2}{2\sigma^2}}}{\sigma \sqrt{2\pi}} dX
$$
其约等于:
$$
GELU(X)=0.5x(1+tanh(\sqrt{2/\pi}(x+0.044715x^3)))
$$
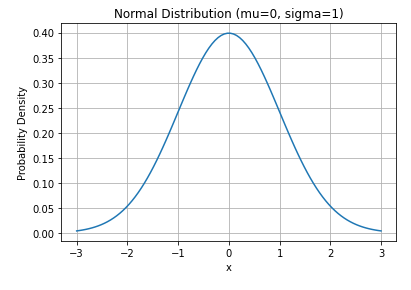
正态分布
首先展示一下正态分布的函数:
$$
f(x) = \frac{1}{\sigma \sqrt{2\pi}} e^{-\frac{(x-\mu)^2}{2\sigma^2}}
$$
下面画一下N(0,1)的图像:
1
2
3
4
5
6
7
8
9
10
11
12
13
14
15
16
17
18
19
20
21
| import numpy as np
import matplotlib.pyplot as plt
from scipy.stats import norm
def plot_normal(mu, sigma):
x = np.linspace(mu - 3*sigma, mu + 3*sigma, 100)
y = norm.pdf(x, mu, sigma)
plt.plot(x, y)
plt.xlabel('x')
plt.ylabel('Probability Density')
plt.title('Normal Distribution (mu={}, sigma={})'.format(mu, sigma))
plt.grid(True)
plt.show()
mu = 0
sigma = 1
plot_normal(mu, sigma)
|
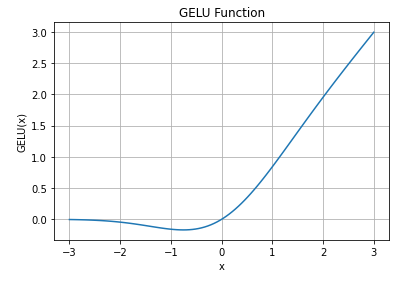
GELU图像
GELU函数图像:
1
2
3
4
5
6
7
8
9
10
11
12
13
14
15
16
17
18
19
| import numpy as np
import matplotlib.pyplot as plt
def gelu(x):
return 0.5 * x * (1 + np.tanh(np.sqrt(2/np.pi) * (x + 0.044715 * x**3)))
x = np.linspace(-3, 3, 100)
y = gelu(x)
plt.plot(x, y)
plt.xlabel('x')
plt.ylabel('GELU(x)')
plt.title('GELU Function')
plt.grid(True)
plt.show()
|
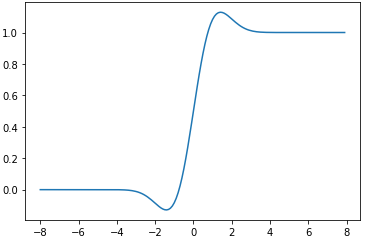
GELU函数导数图像:
1
2
3
4
5
6
7
8
9
10
11
12
13
14
15
16
17
18
19
20
21
22
23
| import numpy as np
import matplotlib.pyplot as plt
import torch
def gelu_1(x):
return 0.5*x*(1 + np.tanh(np.sqrt(2/np.pi)*(x + 0.044715*x**3)))
def gelu_dao(inputs):
return ((np.tanh((np.sqrt(2) * (0.044715 * inputs ** 3 + inputs)) / np.sqrt(np.pi)) + ((np.sqrt(2) * inputs * (
0.134145 * inputs ** 2 + 1) * ((1 / np.cosh(
(np.sqrt(2) * (0.044715 * inputs ** 3 + inputs)) / np.sqrt(np.pi))) ** 2)) / np.sqrt(np.pi) + 1))) / 2
def plot_gelu():
x1=np.arange(-8,8,0.1)
y1=gelu_1(x1)
y2=gelu_dao(x1)
plt.plot(x1,y2)
plt.show()
if __name__ == '__main__':
plot_gelu()
|
Author:
Jiaqi Li
Permalink:
http://example.com/2023/10/17/GELU/
License:
Copyright (c) 2019 CC-BY-NC-4.0 LICENSE
Slogan:
Do you believe in DESTINY?